by William R. Dudleston
Through the years of qualitatively evaluating loudspeaker designs, I have employed a simple quantitative method for measuring a loudspeaker system’s ability to maintain signal correlation between channels in a reverberant field. I have labeled this empirical indicator the IMAGING INDEX. This method can also be used to fine-tune speaker/listener relationships within a listening room to achieve optimal stereo imaging. It requires little more than a sound pressure level meter and pink noise as a source. But first some fundamentals should be acknowledged.
Imaging Basics
Historically, the term stereo is derived from the Greek word meaning solid, or three dimensional. Likewise, the goal of stereo reproduction is to create a solid, holographic image for the observer. While this can involve a variety of specialized recording techniques to encode the stereo effect, the traditional stereo setup is all that is required for playback or recreation of this stereo image. It has been well established that the interpretive sensory phenomenon known as “imaging”is dependent on the preservation of interchannel phase and amplitude relationships in the program material. Conceding that the listener is often granted very little flexibility in room layout, it is important to acknowledge some of the factors that can affect imaging.
- The path length of each speaker to the listener (affecting relative phase, arrival time and amplitude).
- The directivity pattern of the speakers.
- The physical orientation of the loudspeakers.
- The degree of performance matching within the speaker pair.
Once the listener has selected a loudspeaker system for a particular listening room, fine-tuning the placement of the loudspeakers and seated listening positions can lead to greatly enhanced enjoyment of the playback system. Just as the signal/noise ratio is relevant in electronics components, so is the direct signal/room noise ratio important to acoustic playback. More precisely the quality of the stereo image is dependent on the ratio of direct (correlated) sound/diffuse sound. This ratio is strongly dependent on the above listed factors.
Determining The Imaging Index
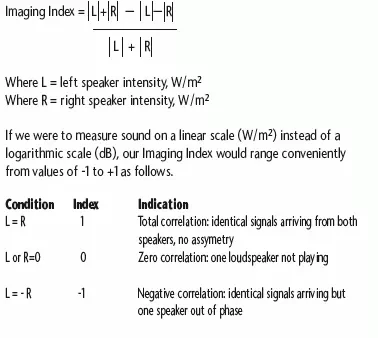
The goal here is to establish the strongest correlation between the two channels at the listener position. The quality of the correlation between the two channels is verified by the in-phase and anti-phase intensity relationship.
If we were to measure sound on a linear scale (W/m2) instead of a logarithmic scale (dB), our Imaging Index would range conveniently from values of -1 to +1 as follows.

Procedure
Rather than trudge through conversions and normalization equations, I prefer to simplify the method to make it useful to anyone who has followed this far. Let’s begin by measuring the imaging index at your existing listening position:
1. First we’ll measure the Anti-phase Acoustic Sum:
- Orient the microphone normal to the plane of the loudspeakers at listener seated height, placing it about where the listener’s nose would be (if you don’t have a mic stand, try a camera tripod or plant stand).
- Play a monophonic (or correlated) pink noise signal through both loudspeakers with the right speaker connected in reverse polarity.
- Set the volume to a reasonable level of about 85 dB, or well above the ambient noise floor.
- Sweep the microphone very slowly side ways about 18 inches to the left and right of the listener’s nose position.
- While sweeping, record the minimum SPL that is found and mark that listening position with a piece of tape. This is your “sweet spot”. It is important that neither the microphone position or volume setting change until you complete the next measurement.
2. Now let’s measure the In-phase Acoustic Sum
- With the microphone still at your sweet spot, reconnect the right speaker in normal polarity.
- Take a reading from the SPL meter, it should read higher.
3. Calculating your IMAGING INDEX:
Let’s say in step 1 we measured a level of 84 dB, and in step 2 we measured a level of 91dB.
Thus:

Conclusion
The IMAGING INDEX is a simple but precise method of quantifying interchannel correlation capabilities within any listening environment, relative to any listener position. It can be measured with full bandwidth pink noise, or can be weighted for a specific frequency range such as 200 – 2000 Hz where the ear is more sensitive to phase. The method is essentially independent of listening volumes, as long as the input voltages remain consistent. You will find using this simple difference method that a good set-up will provide an Index of about 6. A poor set-up will have an Index approaching 0, and a system polarized incorrectly will leave you with a negative Index.
Biography
William R. Dudleston is President of Legacy Audio and has an active role in the design and testing of each of Legacy’s speaker designs. A graduate of the University of Illinois with degrees in chemical engineering and mathematics, Dudleston served as a process design engineer in the technology department for U.S. Industrial Chemicals, a major polymer manufacturer.
Dudleston later supervised a digital research and calibrations laboratory before co-founding Legacy in 1983. Dudleston’s fascination with audio began at an early age. By age 12 he received a science award for constructing a working radio and headset from a block of wood, 100 feet of wire, a Germanium diode, and a magnet. By age 16, his enthusiasm had led to the creation of soundtracks for radio theater. High school presentations included an elaborate lens loaded coaxial loudspeaker design utilizing a custom built bucketbrigade time delay for rear channel applications. Always intrigued by the recording process, Dudleston has mastered a number of recordings for private labels. As research director for Legacy Audio, Dudleston’s work in acoustics has led to advances such as the renowned Field Optimized Convergent Source technology (FOCUS) and the differential alignment used in the Whisper system, the world’s first full range controlled directivity design.